EMAIL subscription
SPAFMSR


Buzgar N., Apopei A. I., Buzatu A. (2009) - Romanian Database of Raman Spectroscopy (http://rdrs.uaic.ro)
| Why donate? If you use this site regularly and would like to help us, please consider donating a small sum. All proceeds go to: + development of this website; + buy some minerals not available yet; + development of RDSS software; + buy some articles or books necessary for Raman study (interpretation). |


Formula: |
CaCO3 |
|
Crystal Data: |
Crystal System: Trigonal - Hexagonal Scalenohedral |
|
Point Group: 3 2/m |
||
Cell Data: |
Space Group: R 3c, a = 4.989, c = 17.062, Z = 6 |
|
Density (calc.) = 2.711 and V = 367.78 Å3 |
||
| Element color: Ca, C, O | ||
 |  |
 |
Sample no. 5413 from the "Mineralogy and Petrography Museum Grigore Cobălcescu" of "Alexandru Ioan Cuza" University, Iaşi. Origin: Guanajuato - Mexic. Click image to enlarge |
||
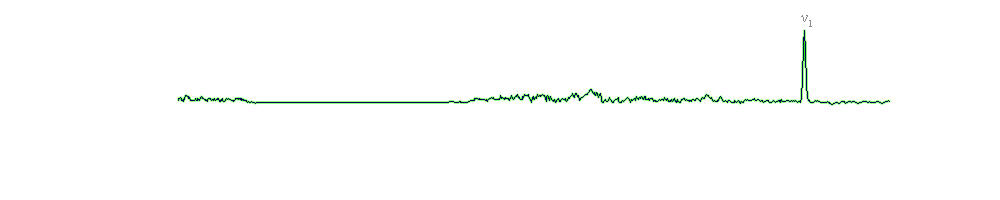
The intense band (ν1) of calcite spectrum corresponds to the symmetric stretching of CO3 group at 1087 cm-1. The ν2 (asymmetric deformation) vibration mode is not active in Raman. The values attributed to ν3 (asymmetric stretching) mode are 1437 cm-1 and ν4 (symmetric deformation) mode at 715 cm-1. Symmetric deformation or symmetric bending, also applies to asymmetric deformation.
The observed vibrational bands of calcite compared with well-documented values are listed below. The minor shift in positions may be due to the effects of natural impurities present in the sample.
| Buzgar et al., 20091 | Gunasekaran et al., 2006 | Free CO32- | Assignment |
| 89 | R(CO3) | ||
| 162 | T(Ca, CO3) | ||
| 285 | 288 | T(Ca, CO3) | |
| 715 | 716 | 680 | ν4 symmetric CO3 deformation |
| 879 | ν2 asymmetric CO3 deformation | ||
| 1087 | 1092 | 1063 | ν1 symmetric CO3 stretching |
| 1437 | 1437 | 1415 | ν3 asymmetric CO3 stretching |
| 1749 | 1754 | ν1 + ν4 |
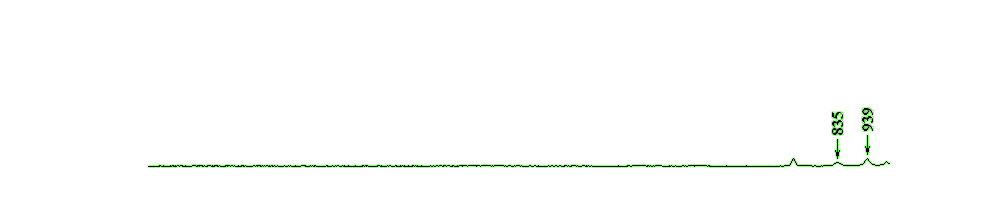
The lower wavenumbers of calcite (285 cm-1) observed in the above table, arise from the external vibration of the CO3 group that involve translatory oscillations of the group (relative translations between the cation and anionic group). In this spectrum are no values below 200 cm-1 because the spectral range is between 200 - 3400 cm-1.
A weak line observed at 1749 cm-1 may be regarded as the combination band of ν1 + ν4 (Gunasekaran et al., 2006). This interpretation is also favoured by Schaefer et al. However and Krishnan assigned this band to 2ν2.
The positions of the observed Raman bands are in agreement with those reported by Gunasekaran et al., 2006.
• The Mineralogy Database [link]
• Crystal data (.cif file) from the American Mineralogist Crystal Structure Database [link]
• 1BUZGAR N., APOPEI A. I. (2009) - The Raman study on certain carbonates. Analele Stiintifice ale Universitatii “Al. I. Cuza” - Iasi, Tome 55, issue 2, 97-112 [link]
• GUNASEKARAN S., ANBALAGAN G., PANDI S. (2006) - Raman and infrared spectra of carbonates of calcite structure. Journal of Raman Spectroscopy, 37, p. 892-899 [link]
| ©2009 - 2014 http://rdrs.uaic.ro • RDRS team | | | | Home • Raman Spectroscopy • Search data • Blog • Links • About • Contact |
| Compatible browsers: Firefox 3+, Microsoft Internet Explorer 8+, Google Chrome 2.0+, Opera 9+ Disabling browser functions such as Javascript may cause certain functionality to be unavailable. |
Romanian Database of Raman Spectroscopy by Buzgar N., Apopei A. I., Buzatu A. is licensed under a Creative Commons Attribution-NonCommercial-NoDerivs 3.0 Unported License. Based on a work at rdrs.uaic.ro. Permissions beyond the scope of this license may be available at http://rdrs.uaic.ro/contact.html. |

|
|
| RDRS Stats |
 Share this page