EMAIL subscription
SPAFMSR


Buzgar N., Apopei A. I., Buzatu A. (2009) - Romanian Database of Raman Spectroscopy (http://rdrs.uaic.ro)
| Why donate? If you use this site regularly and would like to help us, please consider donating a small sum. All proceeds go to: + development of this website; + buy some minerals not available yet; + development of RDSS software; + buy some articles or books necessary for Raman study (interpretation). |


Formula: |
[]Na2(Mg3Al2)Si8O22(OH)2 |
|
Crystal Data: |
Crystal System: Monoclinic - Prismatic |
|
Point Group: 2/m |
||
Cell Data: |
Space Group: C 2/m, a = 9.541, b = 17.74, c = 5.295, Z = 2 |
|
| Using the mouse (click here for more information) |
Density (calc.) = 2.99 and V = 870.83 Å3 |
|
| Element color: Na, Mg, Al, Si, O, H | ||
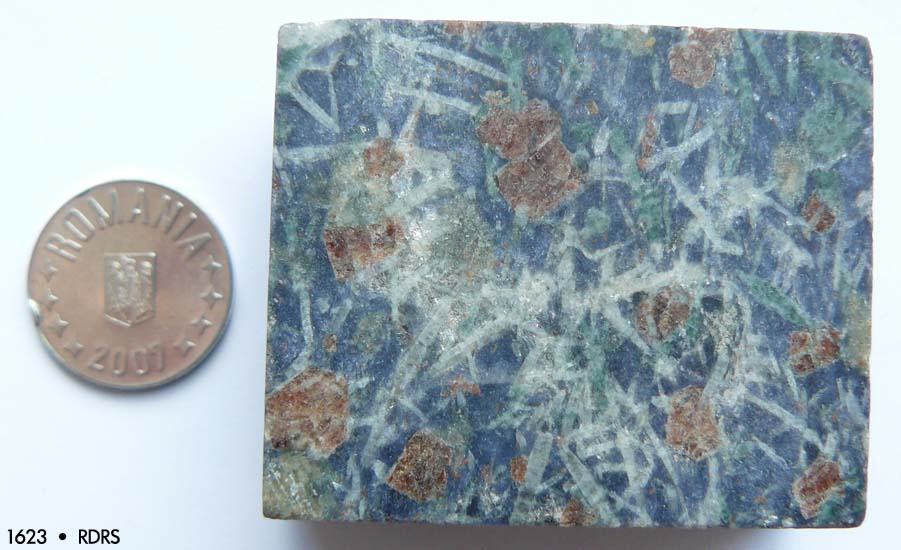 |
Sample no. 1623 from the "Mineralogy and Petrography Museum Grigore Cobălcescu" of "Alexandru Ioan Cuza" University, Iaşi. Origin: Sesia, West Alps, Italy. Click image to enlarge |
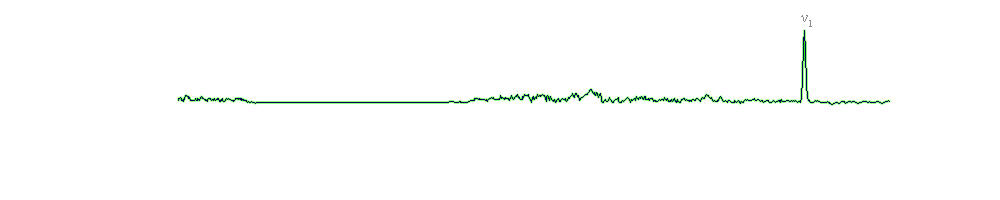
A comparison between the Raman spectra of glaucophane samples (three recorded spectra at different parameters) and one reference spectrum from the RRUFF project is illustrated in figure 9 (see reference paper1 / above spectra). The minor discrepancies concern the shifted peaks in our spectra at: 1011 cm-1, 1014 cm-1 and 1010 cm-1, respectively (for 4-1, 4-1 and 4-1), while in the glaucophane reference spectrum the band exhibits at 984 cm-1. The interpretation of the spectra in the 200-650 cm-1 region is generally based on the bands dominantly arising from the vibrations of the M-O (cation-oxygen; between 300 and 450 cm-1) and bending vibrations of the main Si4O11 structural unit (between 450 and 615 cm-1).
The dominant peak (385-388 cm-1) of the lower spectral region is characteristic to glaucophane Raman spectra; if we look carefully, this band has a shoulder peak at 409-410 cm-1 (in our spectra and in reference R050333). The bands below 300 cm-1 may be assigned to the lattice mode. The highest-frequency peak, observed in the Raman spectra of glaucophane samples at 670 cm-1, also present in the reference spectra at 669 cm-1, is attributed to the symmetric stretching (ν1) of the Si-Ob-Si bridges.
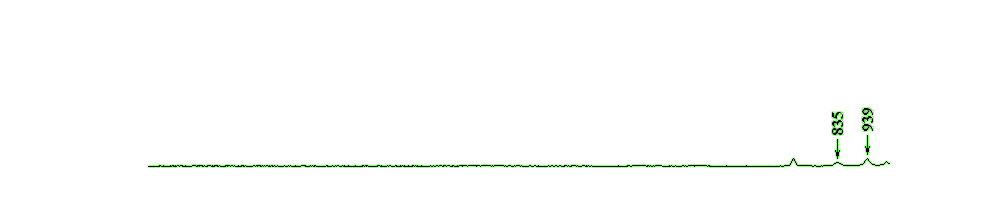
Also, the spectral lines around ~743 cm-1 may be ascribed to the symmetric stretching vibration of the Si-Ob-Si bridges. The symmetric stretching (νs) of the O-Si-O linkage is represented by the bands between 774 cm-1 and 895 cm-1. As is visible in figure 9 (see reference paper1), one band exhibits in all spectra around ~928 cm-1, and may be assigned to the asymmetric stretching vibration of the O-Si-O group. The bands at 985 and 984 cm-1 are shifted with ~30 cm-1, in comparison with our spectra; the assignment of these bands remains questionable because they are probably the νas of the Si-Ob-Si, although the peak value is in the νas region of the O-Si-O linkage. The wavenumbers between 1000 and 1110 cm-1 are assigned to the νas (asymmetric stretching) of the Si-Ob-Si bridges. The 1100 region of the 4-1 spectra presents a very low signal-to-noise ratio.
| Apopei and Buzgar (2010)1 | Huang (2003) | Downs (2006) | Tentative assignment | ||
| Sample: 1623 (4-1) | 1623 (4-1) | 1623 (4-1) | #Mg 52 | R050333 | |
| 225, 258 | 225, 284 |
223, 261, 293 |
209, 227, 254 |
255 | lattice mode |
| 340 388, 410 447 |
341 388, 409 449 |
340 387, 410 449 |
336 386, 405 445 |
306, 335 385, 410 444 |
M-O |
| 490, 560, 615 |
560, 611 |
560, 612 |
520, 558, 609 |
489, 555, 607 |
deformation modes of Si4O11 |
| 670 | 670 | 670 | 668 | 669 | νs of the Si-Ob-Si (ν1) |
| 743 | 743 | 743 | 682, 740 | 743 | νs of the Si-Ob-Si |
| 781, 893 | 780, 810, 893 |
780, 812, 893 |
776, 789, 895 |
774, 891 | νs of the O-Si-O |
| 928 | 928 | 928 | - | 930 | νas of the O-Si-O |
| - | - | - | 985 | 984 | ? |
| 1011, 1045, 1106 |
1014, 1046, 1106 |
1010, 1045, 1107 |
1008, 1045, 1104 |
1046, 1106 |
νas of the Si-Ob-Si |
| ? - questionable interpretation; νs - symmetric stretching; νas - asymmetric stretching; Mg# = (Mg/Mg+Fe2+). | |||||
• The Mineralogy Database [link]
• Crystal data (.cif file) from the American Mineralogist Crystal Structure Database [link]
• 1APOPEI A. I., BUZGAR N. (2010) - The Raman study of amphiboles. Anal. Şt. Univ. “Al. I. Cuza” Iaşi, Geologie, LVI/1 [link]
• Glaucophane spectrum from the RRUFF project [link]
• Downs, R. T. 2006. The RRUFF Project: an integrated study of the chemistry, crystallography, Raman and infrared spectroscopy of minerals. Program and Abstracts of the 19th General Meeting of the International Mineralogical Association in Kobe, Japan. O03-13.
• Huang, E. (2003) - Raman Spectroscopic Study of Amphiboles. PhD thesis in Chinese.
| ©2009 - 2014 http://rdrs.uaic.ro • RDRS team | | | | Home • Raman Spectroscopy • Search data • Blog • Links • About • Contact |
| Compatible browsers: Firefox 3+, Microsoft Internet Explorer 8+, Google Chrome 2.0+, Opera 9+ Disabling browser functions such as Javascript may cause certain functionality to be unavailable. |
Romanian Database of Raman Spectroscopy by Buzgar N., Apopei A. I., Buzatu A. is licensed under a Creative Commons Attribution-NonCommercial-NoDerivs 3.0 Unported License. Based on a work at rdrs.uaic.ro. Permissions beyond the scope of this license may be available at http://rdrs.uaic.ro/contact.html. |

|
|
| RDRS Stats |
 Share this page