EMAIL subscription
SPAFMSR


Buzgar N., Apopei A. I., Buzatu A. (2009) - Romanian Database of Raman Spectroscopy (http://rdrs.uaic.ro)
| Why donate? If you use this site regularly and would like to help us, please consider donating a small sum. All proceeds go to: + development of this website; + buy some minerals not available yet; + development of RDSS software; + buy some articles or books necessary for Raman study (interpretation). |


Formula: |
CaSO4•2(H2O) |
|
Crystal Data: |
Crystal System: Monoclinic - Prismatic |
|
Point Group: 2/m |
||
Cell Data: |
Space Group: A2/a, a = 5.68, b = 15.18, c = 6.29, Z = 4 |
|
Density (calc.) = 2.31 and V = 496.09 Å3 |
||
| Element color: Ca, S, O, H | ||
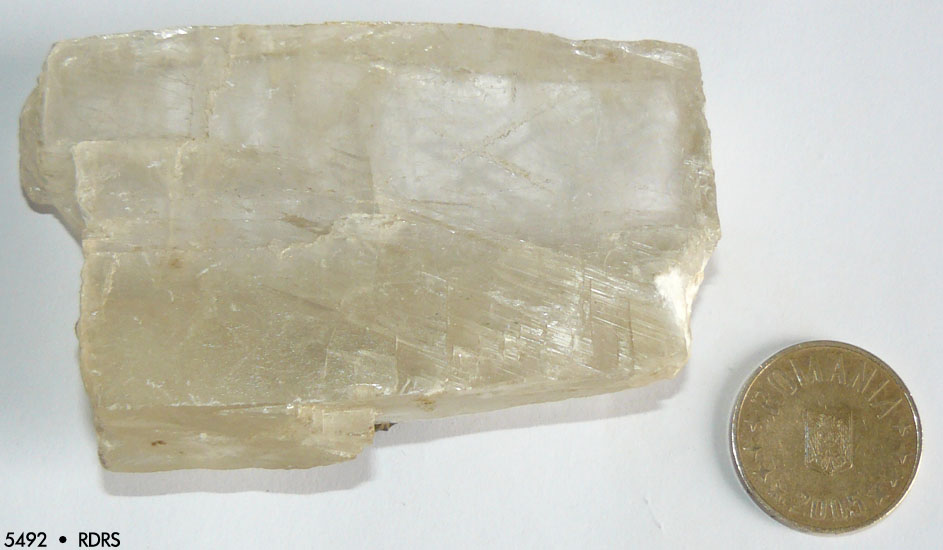 |
Sample no. 5492 from the "Mineralogy and Petrography Museum Grigore Cobălcescu" of "Alexandru Ioan Cuza" University, Iaşi. Origin: Cavnic - Romania. Click image to enlarge |
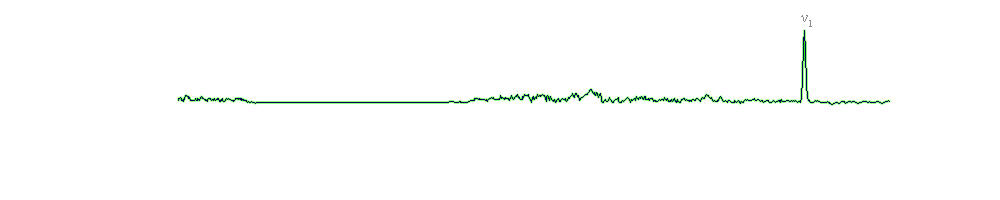
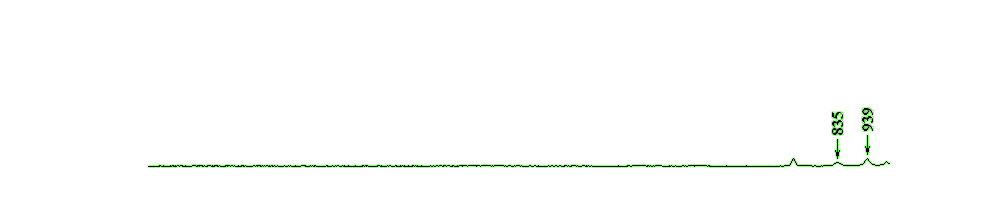
The strongest Raman spectrum of gypsum was found at 1010 cm-1 and corresponds to the ν1 symmetric stretch vibration mode of the SO4 tetrahedra. Gypsum exhibits doublet for ν2 symmetric bending, at 416 cm-1 and 495 cm-1. The peak at 1143 cm-1 was assigned to the ν3 asymmetric stretch vibration mode, and the peaks at 622 cm-1 and 674 cm-1 to the ν4 asymmetric bending vibration modes. Another band that appears at 316 cm-1 has been assigned to the translational modes T(H2O, Ca) (Sarma et al., 1998).
A comparison between the gypsum and anhydrite spectra. It can be observed that the internal modes frequencies of SO4 group are similar. In anhydrite the ν3 mode is split in two bands and can be explained by the distortion of SO4 tetrahedra. The oxygen atoms of SO4 groups are in different crystallographic environments. In gypsum, they are coordinated with a calcium atom and two water molecules, and in anhydrite with two calcium atoms. Therefore, the changes in the vibrational modes of the sulfate group could be a consequence of the dehydration process (Sarma et al., 1998). In other words, the wavenumbers of the bands increase with a decrease of the hydration degree, from gypsum (CaSO4•2H2O) to bassanite (CaSO4•0.5H2O) to anhydrite (CaSO4).
Because the measurements were made in the spectral range 200 – 3400 cm-1, we could not the characteristic bands for the stretching vibration modes of water in gypsum. They have been reported in literature at values of 3406 cm-1 and 3494 cm-1 (White, 2008).
| Anhydrite (Buzgar et al., 20091) | Bassanite (Liu et al., 2009) | Gypsum | Assignments | |
| Buzgar et al., 20091 | White, 2008 | |||
| 235 | T(H2O, Ca) | |||
| 316 | ||||
| 419 | 427 | 416 | 415 | ν2 SO4 |
| 503 | 489 | 495 | 494 | |
| 630 | 628 | 622 | 620 | ν4 SO4 |
| 678 | 668 | 674 | 671 | |
| 1017 | 1015 | 1010 | 1008 | ν1 SO4 |
| 1129 | 1128 | 1143 | 1136 | ν3 SO4 |
| 1160 | ||||
• The Mineralogy Database [link]
• Crystal data (.cif file) from the American Mineralogist Crystal Structure Database [link]
• 1BUZGAR N., BUZATU A., SANISLAV I. V. (2009) - The Raman study on certain sulfates. Analele Stiintifice ale Universitatii “Al. I. Cuza” - Iasi, Tome 55, issue 1, 5-23 [link]
• Sarma, L. P., Prasad, P. S. R., Ravikumar N. (1998) - Raman Spectroscopic Study of Phase Transitions in Natural Gypsum. Journal of Raman Spectroscopy, 29, 851-856 [link]
• Liu, Y., Wang, A., Freeman, J. J. (2009) - Raman, MIR, and NIR spectroscopic study of calcium sulfates: gypsum, bassanite, and anhydrite. 40th Lunar and Planetary Science Conference. The Woodlans, Texas. [link]
• White, S. N. (2008) - Laser Raman spectroscopy as a technique for identification of seafloor hydrothermal and cold seep minerals. Chemical Geology, 15589. [link]
| ©2009 - 2014 http://rdrs.uaic.ro • RDRS team | | | | Home • Raman Spectroscopy • Search data • Blog • Links • About • Contact |
| Compatible browsers: Firefox 3+, Microsoft Internet Explorer 8+, Google Chrome 2.0+, Opera 9+ Disabling browser functions such as Javascript may cause certain functionality to be unavailable. |
Romanian Database of Raman Spectroscopy by Buzgar N., Apopei A. I., Buzatu A. is licensed under a Creative Commons Attribution-NonCommercial-NoDerivs 3.0 Unported License. Based on a work at rdrs.uaic.ro. Permissions beyond the scope of this license may be available at http://rdrs.uaic.ro/contact.html. |

|
|
| RDRS Stats |
 Share this page