EMAIL subscription
SPAFMSR


Buzgar N., Apopei A. I., Buzatu A. (2009) - Romanian Database of Raman Spectroscopy (http://rdrs.uaic.ro)
| Why donate? If you use this site regularly and would like to help us, please consider donating a small sum. All proceeds go to: + development of this website; + buy some minerals not available yet; + development of RDSS software; + buy some articles or books necessary for Raman study (interpretation). |


Formula: |
CaFe2+Si2O6 |
|
Crystal Data: |
Crystal System: Monoclinic - Prismatic |
|
Point Group: 2/m |
||
Cell Data: |
Space Group: C 2/c, a = 9.827, b = 8.994, c = 5.261, Z = 4 |
|
| Using the mouse (click here for more information) |
Density (calc.) = 3.68 and V = 448.03 Å3 |
|
| Element color: Ca, Fe, Si, O | ||
 |
 |
Sample no. 5792 and 5799 from the "Mineralogy and Petrography Museum Grigore Cobălcescu" of "Alexandru Ioan Cuza" University, Iaşi. Origin (no. 5792): Nordmasken, Sweden. Origin (no. 5799): Nordmasken, Sweden. Click image to enlarge |
Toggle Grid Toggle Coordinates Reverse Spectrum |
Download spectrum: Raman spectrum .txt Raman spectrum .spc |
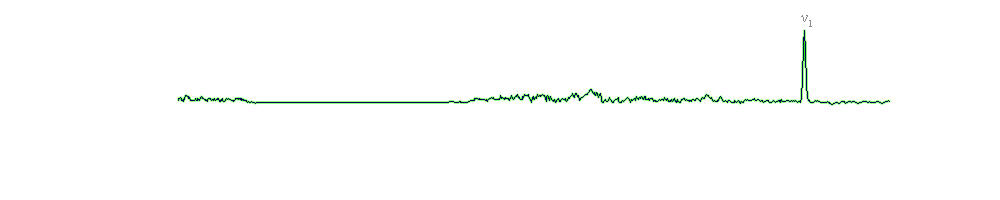
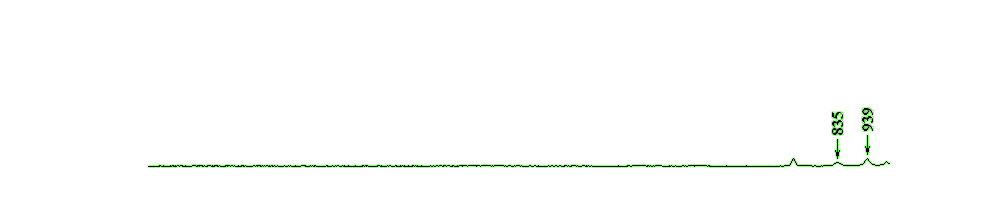
For clinopyroxenes, the group theory predicts 30 Raman modes: 14Ag + 16Bg (Rustein and White, 1971).
The spectra of diopside and hedenbergite (see reference paper1 or above spectrum for hedenbergite) are also characterized by two intense bands, corresponding to the Si-Onbr stretching mode (1010 cm-1 in diopside and 1012 cm-1 in hedenbergite) and to the stretching of Si-Obr bonds (665 cm-1 in diopside and 663 cm-1 in hedenbergite). In the 500-560 cm-1 region, bands assigned to the O-Si-O bending modes were observed, and in the lower region, bands attributed to the cation-oxygen vibrations (see below table).
| Diopside | Hedenbergite | Aassignments | ||||
| Buzatu and Buzgar (2010)1 | Huang et al. (2000) | Buzatu and Buzgar (2010)1 | Huang et al. (2000) | |||
| Sample: 5790 | 5791 | 5792 | 5799 | |||
| 230 248 296 323 358 389 |
229 247 323 359 389 |
230 255 325 359 392 |
245 315 346 381 |
231 315 346 381 |
233 307 338 375 404 |
M-O stretch/bend |
| 507 531 558 |
527 560 |
509 529 558 |
522 555 |
499 524 553 |
495 522 549 |
O-Si-O bend |
| 665 |
666 |
665 |
663 758 |
663 |
660 750 |
Si-Obr stretch |
| 853 1010 1045 |
852 907 1010 1045 |
854 1011 1047 |
853 890 908 1010 1036 |
852 894 1012 |
853 907 1012 1031 |
Si-Onbr stretch |
Huang et al. (2000) showed that with a constant Ca content most Raman bands in diopside-hedenbergite series should decrease with an increase of the Fe concentration. In all spectra from the present study, this observation is available only for the bands located in the 200-800 cm-1 region and for the peak from ~1040 cm-1; the ~850 cm-1 band preserves the same position, and the band at ~1010 cm-1 is slightly higher in hedenbergite (1010 cm-1 in diopside samples and 1012 cm-1 in hedenbergite sample 5799). The Raman spectra of diopside are similar to those reported in the literature (Etchepare, 1971; Swamy et al., 1997; Huang et al., 2000). The spectra of hedenbergite are different from those reported by Huang et al. (2000) (see above table), especially for the low region attributed to the cation-oxygen vibration modes. These differences are probably caused by a higher content of Mg in M1 sites in our studied samples.
• The Mineralogy Database [link]
• Crystal data (.cif file) from the American Mineralogist Crystal Structure Database [link]
• 1BUZATU A., BUZGAR N. (2010) - The Raman study of single-chain silicates. Anal. Şt. Univ. “Al. I. Cuza” Iaşi, Geologie, LVI/1. [link]
• Huang, E., Chen, C.H., Huang, T., Lin, E.H., Xu, J., (2000) - Raman spectroscopic characteristics of Mg-Fe-Ca pyroxenes. American Mineralogist, 85, 473–479.
• Rutstein, M.S., White, W.B., (1971) - Vibrational spectra of high-calcium pyroxenes and pyroxenoids. American Mineralogist, 56, 877–887.
• Etchepare, J., (1971) - Study by Raman spectroscopy of crystalline and glassy diopside. In: Douglas, R.W., Ellis, B. (Eds.), Amorphous materials. Wiley Interscience, London, 337–346.
• Swamy, V., Dubrovinsky, L.S., Matsui, M., (1997) - High-temperature Raman spectroscopy and quasi-harmonic lattice dynamic simulation of diopside. Phys. Chem. Minerals, 24, 440–446.
| ©2009 - 2014 http://rdrs.uaic.ro • RDRS team | | | | Home • Raman Spectroscopy • Search data • Blog • Links • About • Contact |
| Compatible browsers: Firefox 3+, Microsoft Internet Explorer 8+, Google Chrome 2.0+, Opera 9+ Disabling browser functions such as Javascript may cause certain functionality to be unavailable. |
Romanian Database of Raman Spectroscopy by Buzgar N., Apopei A. I., Buzatu A. is licensed under a Creative Commons Attribution-NonCommercial-NoDerivs 3.0 Unported License. Based on a work at rdrs.uaic.ro. Permissions beyond the scope of this license may be available at http://rdrs.uaic.ro/contact.html. |

|
|
| RDRS Stats |
 Share this page