EMAIL subscription
SPAFMSR


Buzgar N., Apopei A. I., Buzatu A. (2009) - Romanian Database of Raman Spectroscopy (http://rdrs.uaic.ro)
| Why donate? If you use this site regularly and would like to help us, please consider donating a small sum. All proceeds go to: + development of this website; + buy some minerals not available yet; + development of RDSS software; + buy some articles or books necessary for Raman study (interpretation). |


Formula: |
[]Ca2Mg5Si8O22(OH)2 |
|
Crystal Data: |
Crystal System: Monoclinic - Prismatic |
|
Point Group: 2/m |
||
Cell Data: |
Space Group: C 2/m, a = 9.8385, b = 18.0554, c = 5.2778, Z = 2 |
|
| Using the mouse (click here for more information) |
Density (calc.) = 2.98 and V = 906.64 Å3 |
|
| Element color: Ca, Mg, Si, O, H | ||
 |
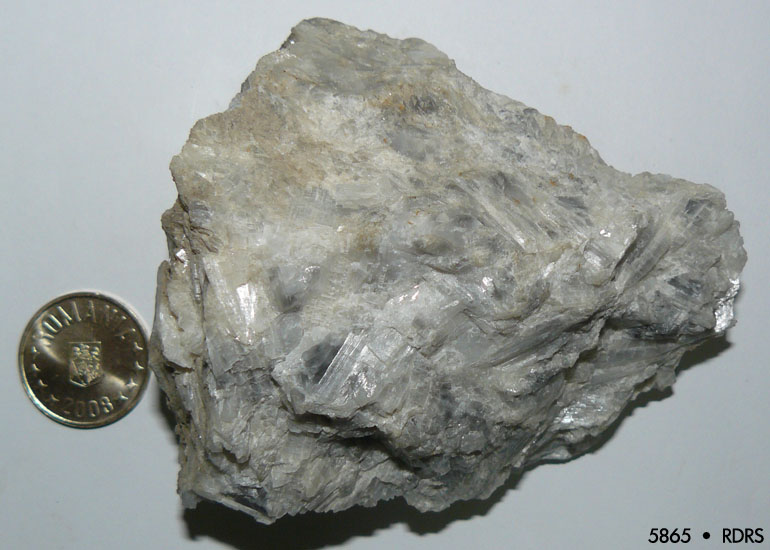 |
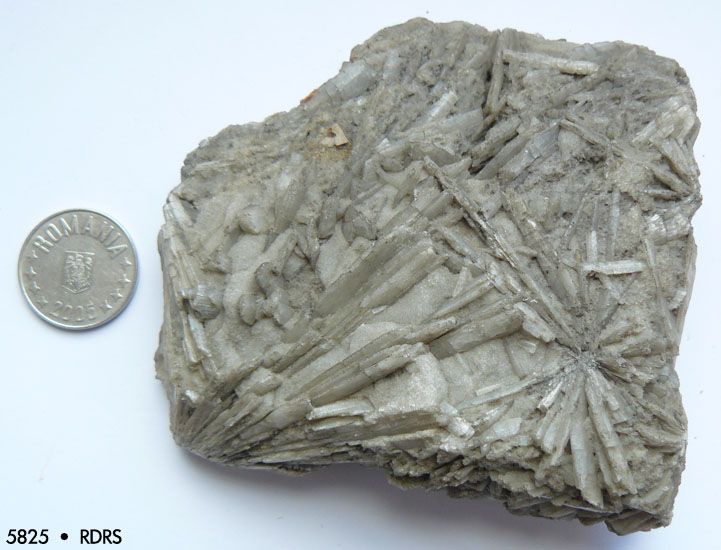
Sample no. 5825 and 5865 from the "Mineralogy and Petrography Museum Grigore Cobălcescu" of "Alexandru Ioan Cuza" University, Iaşi. Origin (no. 5825): Campolongo, Switzerland. Origin (no. 5865): Voşlobeni, Romania. Click image to enlarge |
Toggle Grid Toggle Coordinates Reverse Spectrum |
Download spectrum: Raman spectrum .txt Raman spectrum .spc |
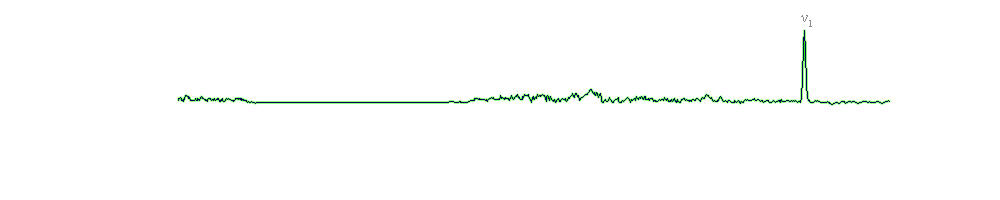
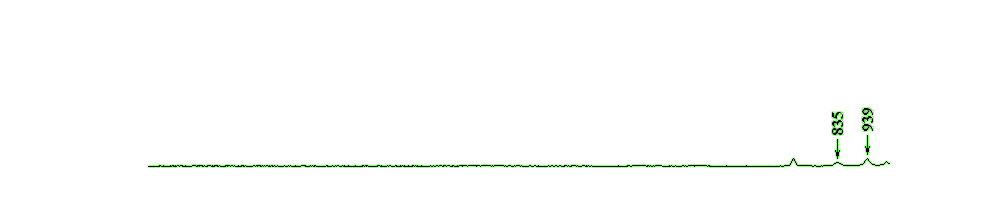
The vibrational assignments of the peaks are given in the below table, while the Raman spectra for the tremolite samples are shown above. Both spectra of tremolite show the ν1 symmetric stretching of the CO3 group at 1083 cm-1; also, the 711 cm-1 peak is assigned to the ν4 bending mode of the CO3 group (Buzgar and Apopei, 2009). The ν4 bending mode of the CO3 group is present only in the 2-9 spectrum of the tremolite sample (with a very low intensity). According to Buzgar and Apopei (2009), the 285 cm-1 band may be ascribed to the vibration (translational vibration) between cation and oxygen (M-O) of the CO3 group [T(Ca, CO3)]; this peak (285 cm-1) is present in the same spectrum of tremolite (2-9) with the ν4 bending mode of the CO3 group. These characteristic bands of calcite (CaCO3) are normal because our tremolite is associated with calcite (in carbonate rocks).
| Apopei and Buzgar (2010)1 | Huang (2003) | Shurvell et al. (2001) | Tentative assignment | |
| Sample: 5825 (2-8) |
5865 (2-9) |
#Mg 93.8 | ||
| 225, 252, 290 |
226, 250 | 221, 230, 250, 288 |
304 | lattice mode |
| - | 285 | - | - | T(Ca, CO3 (calcite inclusions) |
| 351 372 394 415 438 |
349 369 394 415 438 |
332, 343 368 393 415 434 |
352 374 395 417 437 |
M-O, where M = Ca and Mg |
| 483, 528 | 484, 525 | 523 | 516, 530 | deformation modes of Si4O11 |
| - | 583 | - | - | ? HO- libration/translation |
| 674 | 674 | 653, 672 | 656, 675 | νs of the Si-Ob-Si (ν1) |
| 711 | ν4 bending mode of the CO3 group (calcite inclusions) | |||
| 746 | 747 | 739, 749 | 747 | ? νs of the Si-Ob-Si |
| 928, 949 | 928, 945 | 929, 945 | 932, 947 | νs of the O-Si-O |
| 1028, 1060 |
1027, 1059 |
1027, 1057 |
1031, 1061 | νas of the Si-Ob-Si |
| 1087 | 1083 | - | - | ν1 symmetric stretching of the CO3 group (calcite inclusions) |
| - | - | - | 1112 | νH3O+ |
| ? - questionable interpretation; νs - symmetric stretching; νas - asymmetric stretching; Mg# = (Mg/Mg+Fe2+). | ||||
The discussion regarding the 1112 cm-1 peak, which appears in the reference spectrum of tremolite samples (Shurvell et al., 2001), is similar to that of nephrite samples. In the spectrum of Shurvell et al. (2001), however, this peak (extremely weak intensity) appears and is assigned to the OH- bending modes.
Both spectra of tremolite samples contain a very strong band at 674 cm-1, which lies in the same spectral region as the symmetric stretching (νs) of the Si-Ob-Si bridges. The 746 cm-1 (2-8) and 747 cm-1 (2-9) bands are debatable (see previous discussions); nevertheless, we assign these bands to the νs of the Si-Ob-Si bridges. In the region between 900 and 1100 cm-1, two symmetric stretching modes of the O-Si-O linkage and two asymmetric stretching vibration modes of the Si-Ob-Si bridges are exhibited.
The lower wavenumber region (< 600 cm-1) is characteristic for the deformation mode of the silicate network with OH- libration/translation (in most cases - overlapped) modes (in the case of the 2-9 sample of tremolite, the 583 cm-1 band is probably a vibration of the OH- libration/translation mode), metal-oxygen modes (300-450 cm-1) and lattice modes (210-300 cm-1).
Bearing in mind the Raman spectra of actinolite samples (see Raman spectrum of Actinolite) and the Raman spectra of tremolite, it is very important to note the differences between these members of this series. Without chemical analysis, the OH- spectral region and/or IR spectra of these minerals, it is very difficult to differentiate between members of a series. Nevertheless, some differences between tremolite and actinolite spectra could be observed. As has been discussed above, the presence of CaCO3 in tremolite spectra may be one reason for the difference between actinolite and tremolite spectra. Another explanation for the similarity between the spectra of actinolite and tremolite lies in the fact that the #Mg content of both minerals is somewhere up to of 90%.
• The Mineralogy Database [link]
• Crystal data (.cif file) from the American Mineralogist Crystal Structure Database [link]
• 1APOPEI A. I., BUZGAR N. (2010) - The Raman study of amphiboles. Anal. Şt. Univ. “Al. I. Cuza” Iaşi, Geologie, LVI/1 [link]
• Huang, E. (2003) - Raman Spectroscopic Study of Amphiboles. PhD thesis in Chinese.
• Shurvell, H. F., Rintoul, L., Fredericks, P. M. (2001) - Infrared and Raman spectra of jade and jade minerals. Internet Journal of Vibrational Spectroscopy, (www.ijvs.com) 5, 5, 4.
| ©2009 - 2014 http://rdrs.uaic.ro • RDRS team | | | | Home • Raman Spectroscopy • Search data • Blog • Links • About • Contact |
| Compatible browsers: Firefox 3+, Microsoft Internet Explorer 8+, Google Chrome 2.0+, Opera 9+ Disabling browser functions such as Javascript may cause certain functionality to be unavailable. |
Romanian Database of Raman Spectroscopy by Buzgar N., Apopei A. I., Buzatu A. is licensed under a Creative Commons Attribution-NonCommercial-NoDerivs 3.0 Unported License. Based on a work at rdrs.uaic.ro. Permissions beyond the scope of this license may be available at http://rdrs.uaic.ro/contact.html. |

|
|
| RDRS Stats |
 Share this page