EMAIL subscription
SPAFMSR


Buzgar N., Apopei A. I., Buzatu A. (2009) - Romanian Database of Raman Spectroscopy (http://rdrs.uaic.ro)
| Why donate? If you use this site regularly and would like to help us, please consider donating a small sum. All proceeds go to: + development of this website; + buy some minerals not available yet; + development of RDSS software; + buy some articles or books necessary for Raman study (interpretation). |


Formula: |
Ca2(Mg,Fe++)5Si8O22(OH)2 |
|
Crystal Data: |
Crystal System: Monoclinic - Prismatic |
|
Point Group: 2/m |
||
Cell Data: |
Space Group: C 2/m, a = 9.84, b = 18.1, c = 5.28, Z = 2 |
|
| Using the mouse (click here for more information) |
Density (calc.) = 3.11 and V = 909.61 Å3 |
|
| Element color: Ca, Mg, Fe, Si, O, H | ||
 |
Sample no. 5841 from the "Mineralogy and Petrography Museum Grigore Cobălcescu" of "Alexandru Ioan Cuza" University, Iaşi. Origin: Brosso, Piedmont, Italy. Click image to enlarge |
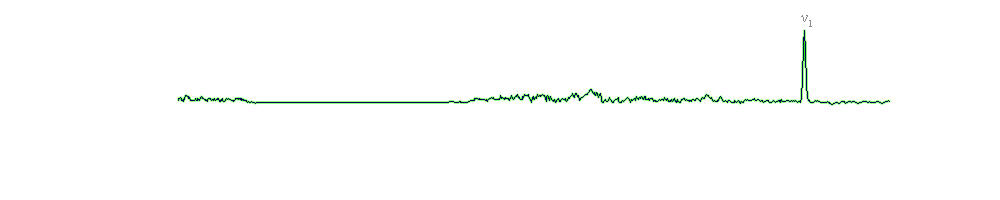
The Raman spectrum of smaragdite (2-6) is slightly different from those recorded on samples of actinolite (the same thing may be said about the Raman spectrum of the uralite sample, but this will be discussed separately). The wavenumbers and assignments of smaragdite and uralite samples (quartz included) are found in table (see above links of smaragdite and uralite) of smaragdite and uralite webpage in comparison with (2-2) actinolite, in order to emphasize small differences between them.
The intense band (ν1) of the smaragdite spectrum corresponds to the symmetric stretching of Si-Ob-Si bridges at 670 cm-1. The differences mentioned above consist in two regions with slightly moved peaks, as follows: in the region of asymmetric stretching of Si-Ob-Si (1000-1130 cm-1), two peaks appear (1027 cm-1 and 1052 cm-1), the second peak being slightly shifted to the left in comparison with 2-2 (see Raman spectrum of actinolite and Raman spectrum of smaragdite); the second difference lies in the region of M-O vibrations, where the highest intensity peak is located at 389 cm-1. The other peaks are very similar to peaks observed in actinolite samples (see table from actinolite webpage for the assignments of all peaks).
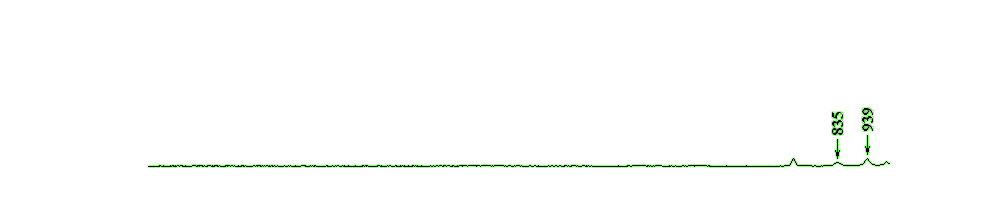
The Raman spectrum of uralite is a special case, as one band at 464 cm-1 is from quartz. It should be noted that the sample of uralite contains some crystals of quartz, this being the reason of the presence of the 464 cm-1 band. The spectrum of the quartz sample is labelled with 2-7b. As smaragdite spectrum, small differences appear in two regions, namely around 1010 cm-1 and in M-O region (see below table). It should be pointed out that no Raman data have been found in the literature for these minerals species (smaragdite and uralite).
| Apopei and Buzgar (2010)1 | Tentative assignment | ||
| Sample: 5852 (2-6) Smaragdite |
5841 (2-7) Uralite |
5835 (2-2) Actinolite |
|
| 222, 247, 300 | 219, 292 | 226, 247, 294 | lattice mode |
| 373 386 415 |
364 388 - |
369 392 415 |
M-O, where M = Ca and Mg, Fe2+ |
| - | 464 | - | from Quartz |
| 487, 527 | 526 | 482, 522, 577 | deformation modes of Si4O11 |
| 670 | 668 | 670 | νs of the Si-Ob-Si (ν1) |
| 744 | 745 | 744 | ? νs of the Si-Ob-Si |
| 928, 952 | 927 | 892, 929, 949 | νs of the O-Si-O |
| 1027 1052 |
1011 1053 |
1027 1059 |
νas of the Si-Ob-Si |
| ? - questionable interpretation; νs - symmetric stretching; νas - asymmetric stretching. | |||
| ©2009 - 2014 http://rdrs.uaic.ro • RDRS team | | | | Home • Raman Spectroscopy • Search data • Blog • Links • About • Contact |
| Compatible browsers: Firefox 3+, Microsoft Internet Explorer 8+, Google Chrome 2.0+, Opera 9+ Disabling browser functions such as Javascript may cause certain functionality to be unavailable. |
Romanian Database of Raman Spectroscopy by Buzgar N., Apopei A. I., Buzatu A. is licensed under a Creative Commons Attribution-NonCommercial-NoDerivs 3.0 Unported License. Based on a work at rdrs.uaic.ro. Permissions beyond the scope of this license may be available at http://rdrs.uaic.ro/contact.html. |

|
|
| RDRS Stats |
 Share this page