EMAIL subscription
SPAFMSR


Buzgar N., Apopei A. I., Buzatu A. (2009) - Romanian Database of Raman Spectroscopy (http://rdrs.uaic.ro)
| Why donate? If you use this site regularly and would like to help us, please consider donating a small sum. All proceeds go to: + development of this website; + buy some minerals not available yet; + development of RDSS software; + buy some articles or books necessary for Raman study (interpretation). |


Formula: |
Ca2(Mg,Fe++)5Si8O22(OH)2 |
|
Crystal Data: |
Crystal System: Monoclinic - Prismatic |
|
Point Group: 2/m |
||
Cell Data: |
Space Group: C 2/m, a = 9.84, b = 18.1, c = 5.28, Z = 2 |
|
| Using the mouse (click here for more information) |
Density (calc.) = 3.11 and V = 909.61 Å3 |
|
| Element color: Ca, Mg, Fe, Si, O, H | ||
 |
 |
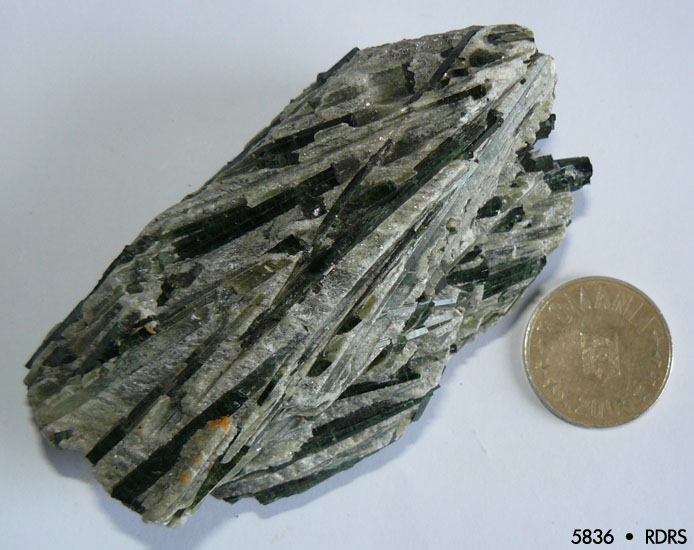 |
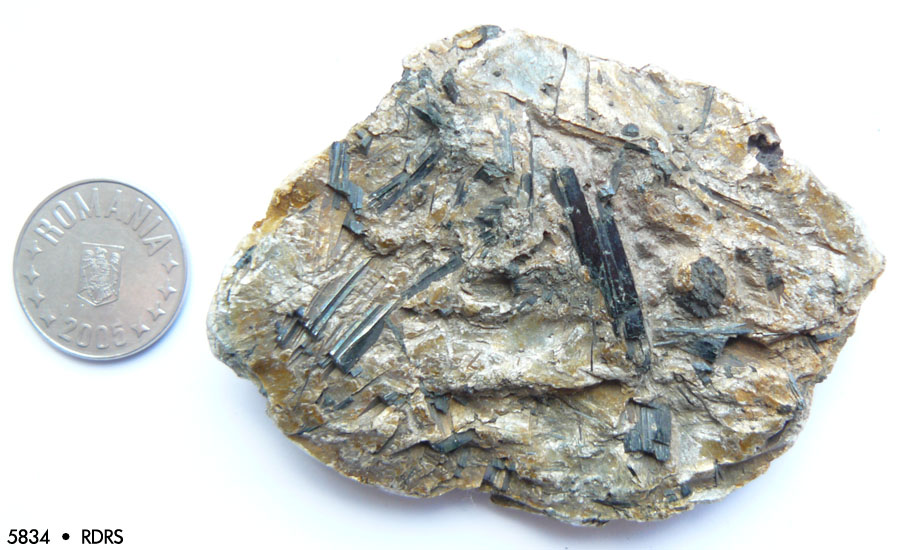
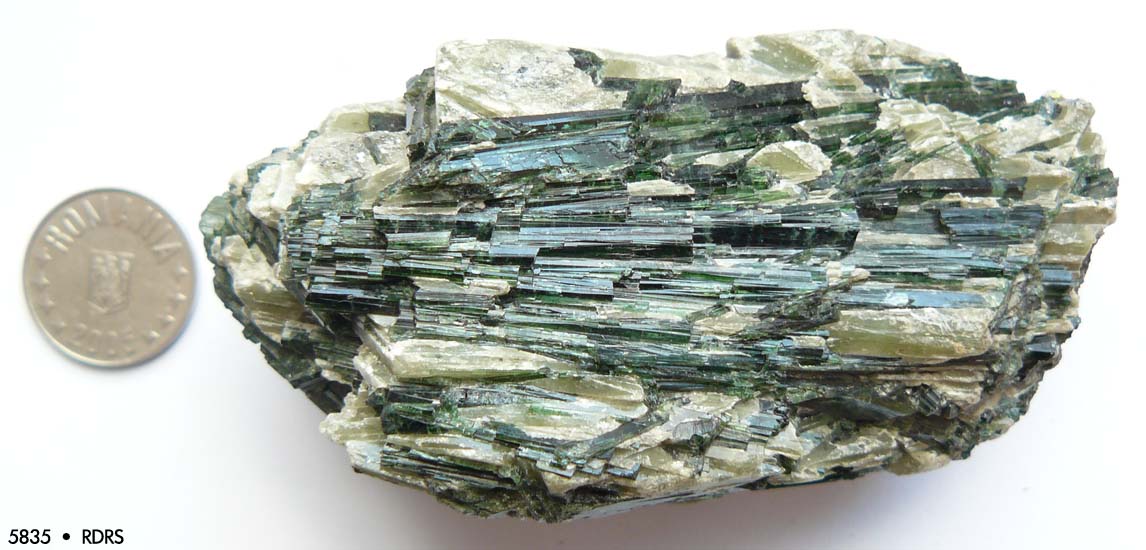
Sample no. 5834, 5835 and 5836 from the "Mineralogy and Petrography Museum Grigore Cobălcescu" of "Alexandru Ioan Cuza" University, Iaşi. Origin (no. 5834): St. Gothard, Switzerland. Origin (no. 5835): Tirol, Austria. Origin (no. 5836): Zemmtal, Tirol, Austria. Click image to enlarge |
||
Toggle Grid Toggle Coordinates Reverse Spectrum |
Download spectrum: Raman spectrum .txt Raman spectrum .spc |
Toggle Grid Toggle Coordinates Reverse Spectrum |
Download spectrum: Raman spectrum .txt Raman spectrum .spc |
Actinolite is a solid solution composition between the endmembers of the following series: tremolite and ferro-actinolite. According to Jovanovski et al. (2009), solutions with more than 90 Mg are called tremolite, between 90-50% - actinolite, and less than 50% - ferro-actinolite. We will discuss the Raman spectra of these minerals separately.
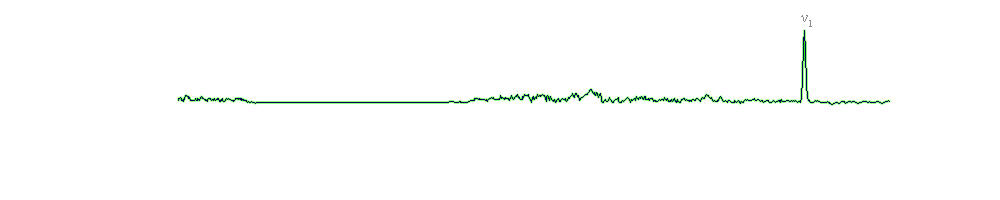
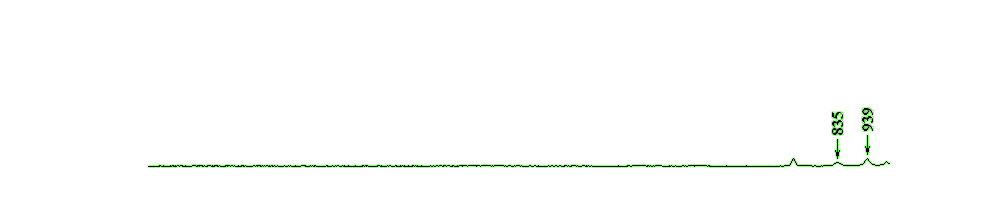
The Raman spectra of these samples are shown in figure 5 (see reference paper1). All of these spectra are very similar, with small differences in the case of very low intensity peaks. In the 650-1200 cm-1 spectral region (the region of internal vibrations), five intense bands appear significantly at 670, 745, 928, 1027 and 1056 cm-1 for the 2-1 sample; 670, 744, 929, 1027 and 1059 cm-1 for 2-2, and 670, 744, 928, 1027, 1059 cm-1 for the 2-3 actinolite sample. In the case of the 928 cm-1 peak (for 2-2 samples this peak exhibits at 929 cm-1), one or two overlapped bands with a very low intensity appear. These peaks (891, 956 cm-1; 892, 949 cm-1 and 946 cm-1, respectively – see fig. 5; reference paper1) are part of O-Si-O symmetric stretching vibrations (νs). As discussed in the case of grunerite, the bands at 1027, 1056 cm-1 (2-1); 1027, 1059 cm-1 (2-2) and 1027, 1059 cm-1 (2-3), respectively, may be ascribed to the antisymmetric stretching vibrations (νas) of the Si-Ob-Si bridges; the bands at 744-745 cm-1 are debatable, given the fact that 750 cm-1 is the limit of νs O-Si-O and νs Si-Ob-Si vibrations. The most intense bands, which appear at 670 cm-1 (in all samples), are ascribed to the ν1 (Ag) symmetric stretching modes (νs) of the Si-Ob-Si bridges.
In the 210-650 cm-1 region, the assignments of the M-O vibrations is problematic; three bands appear in the 300-450 cm-1 spectral region (for 2-1: 369, 389 and 413 cm-1; 2-2: 369, 392 and 415 cm-1, and 369, 392 and 415 cm-1 for 2-3), where we would expect to see vibrations produced by Ca, Mg and/or Fe2+ cations [Ca2(Mg,Fe2+)5Si8O22(OH)2 – ideal chemistry for actinolite]. Nevertheless, the bands between 210-300 cm-1 are assigned to lattice modes (for 2-1: 221, 247 and 292 cm-1, for 2-2: 226, 247, 294 cm-1, and 222 and 292 cm-1 for 2-3).
The following bands: 479, 523 and 573 cm-1 (for 2-1); 482, 522 and 577 cm-1 (2-2), and 484, 522 and 581 cm-1 (2-3) correspond to the deformation modes of Si4O11, with the observation that in this region there should be a librational and translational vibration of the OH- group (probably 573, 577 and 581 cm-1 bands; see fig. 5 - reference paper1).
The Raman spectrum of the sample of actinolite (2-1) shows one peak at 2327 cm-1; this band may be assigned to the H3O+ vibration. This is due to a substitution between H3O+ and a cation from the M sites.
| Apopei and Buzgar (2010)1 | Shurvell et al. (2001) | Huang (2003) | Tentative assignment | ||
| Sample: 5834 (2-1) | 5835 (2-2) | 5836 (2-3) | #Mg 89.9 | ||
| 221, 247, 292 |
226, 247, 294 |
222, 292 |
- | 222, 231, 249, 263, 303 |
lattice mode |
| 369 389 413 |
369 392 415 |
369 392 415 |
350, 369 392 415, 436 |
348, 371 393 415, 434 |
M-O, where M = Ca and Mg, Fe2+ |
| 479, 523, 573 |
482, 522, 577 |
484, 522, 581 |
513, 532 |
529 | deformation modes of Si4O11 |
| 670 | 670 | 670 | 673 | 673 | νs of the Si-Ob-Si (ν1) |
| 745 | 744 | 744 | 740 | - | ? νs of the Si-Ob-Si |
| 891, 928 |
892, 929, 949 |
928, 946 |
749, 930, 947 |
749, 929, 947 |
νs of the O-Si-O |
| 956 | ? νs of the O-Si-O | ||||
| 1027 1056 |
1027 1059 |
1027 1059 |
1029 1058 |
1027 1057 |
νas of the Si-Ob-Si |
| 2327 | νH3O+ | ||||
| ? - questionable interpretation; νs - symmetric stretching; νas - asymmetric stretching; Mg# = (Mg/Mg+Fe2+). | |||||
• The Mineralogy Database [link]
• Crystal data (.cif file) from the American Mineralogist Crystal Structure Database [link]
• 1APOPEI A. I., BUZGAR N. (2010) - The Raman study of amphiboles. Anal. Şt. Univ. “Al. I. Cuza” Iaşi, Geologie, LVI/1 [link]
• Huang, E. (2003) - Raman Spectroscopic Study of Amphiboles. PhD thesis in Chinese.
• Jovanovski, G., Makreski, P., Kaitner, B., Boev, B. (2009) - Silicate Minerals from Macedonia. Complementary Use of Vibrational Spectroscopy and X-ray Powder Diffraction for Identification and Detection Purposes. Croatica chemica acta, 82 (2), 363-386.
• Shurvell, H. F., Rintoul, L., Fredericks, P. M. (2001) - Infrared and Raman spectra of jade and jade minerals. Internet Journal of Vibrational Spectroscopy, (www.ijvs.com) 5, 5, 4.
| ©2009 - 2014 http://rdrs.uaic.ro • RDRS team | | | | Home • Raman Spectroscopy • Search data • Blog • Links • About • Contact |
| Compatible browsers: Firefox 3+, Microsoft Internet Explorer 8+, Google Chrome 2.0+, Opera 9+ Disabling browser functions such as Javascript may cause certain functionality to be unavailable. |
Romanian Database of Raman Spectroscopy by Buzgar N., Apopei A. I., Buzatu A. is licensed under a Creative Commons Attribution-NonCommercial-NoDerivs 3.0 Unported License. Based on a work at rdrs.uaic.ro. Permissions beyond the scope of this license may be available at http://rdrs.uaic.ro/contact.html. |

|
|
| RDRS Stats |
 Share this page