Please cite this website as:

Buzgar N., Apopei A. I., Buzatu A. (2009) - Romanian Database of Raman Spectroscopy (http://rdrs.uaic.ro)


PIGMENTS


MINERALS


EMAIL subscription


SPAFMSR

PNII - IDEI COD 2119/2008


Alexandru Ioan Cuza UniversityFaculty of Geography and Geology

Locations of visitors to this page

Why donate? If you use this site regularly and would like to help us, please consider donating a small sum.
All proceeds go to:
+ development of this website;
+ buy some minerals not available yet;
+ development of RDSS software;
+ buy some articles or books necessary for Raman study (interpretation).

Decrease Font Size Increase Font Size
Don't forget to bookmark us! | Share this page


Grunerite: Crystal structure | Sample photo | Raman spectrum | Interpretation | References

Crystal structure of Grunerite

Formula:

[]Fe++7Si8O22(OH)2

Crystal Data:

Crystal System: Monoclinic - Prismatic

Point Group: 2/m

Cell Data:

Space Group: C 2/m, a = 9.57, b = 18.22, c = 5.33, Z = 2

Using the mouse (click here for more information)

Density (calc.) = 3.66 and V = 908.72 Å3

Element color: Fe, Si, O, H
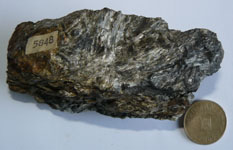
Grunerite sample
Grunerite

Sample no. 5848 from the "Mineralogy and Petrography Museum Grigore Cobălcescu" of "Alexandru Ioan Cuza" University, Iaşi.

Origin: Schneeberg, Tirol, Austria.


Click image to enlarge

Raman spectrum of Grunerite

Toggle Grid Toggle Coordinates Reverse Spectrum

Download spectrum:


Raman spectrum .txt

Raman spectrum .spc

Interpretation of Raman spectrum of Grunerite

Prior to any discussions about the Raman spectra of the grunerite samples, it should be noted that in some papers the term grunerite is replaced with amosite (the commercial name for grunerite).

For each grunerite spectrum, the peaks are listed below with all assignments. These spectra are very similar – the ν1 (A1g) symmetric stretching (νs) of the Si-Ob-Si bridge is shown in all spectra (fig. 4, see reference paper) around 660 cm-1, more exactly at 665 cm-1 for the grunerite samples of this work and at 663 cm-1 and 661 cm-1, respectively, for reference spectra (R070186 and R060062). In the 745-790 cm-1 spectral region, three bands are shown in the grunerite sample, with the main band at 761 cm-1 (the other two peaks are located at 747 cm-1 and 785 cm-1, respectively). These bands are assigned to the symmetric stretching (νs) of the O-Si-O linkage. Also, the 909 cm-1 spectral band is assigned to the νs of the O-Si-O linkage (all of these bands assigned to the νs of the O-Si-O linkage have a low intensity).

The bands situated in the upper region of the 950 cm-1 wavenumber (950-1200 cm-1) are assigned to antisymmetric (or asymmetric) stretching vibration (νas). More specifically, the band at 971 cm-1 may be assigned to the νas of the O-Si-O linkage. We consider that the peak at 999 cm-1 is part of the 1027 cm-1 vibration (due to the fact that, in the reference spectra of Bard et al. (1997) and Rinaudo et al. (2004), this peak is slightly overlapped), which, together with the peak at 1098 cm-1, is assigned to νas Si-Ob-Si bridges. The overlapping of the 999 cm-1 peak can be seen even in figure 4 (see reference paper) (in the case of R060062).


Apopei and Buzgar (2010)1 Downs (2006) Rinaudo et al. (2004) Tentative assignment
Sample: 5848 R070186 amosite fibres
- - 155, 182 ?
242, 289 242, 288, 316 252, 289, 307 lattice mode
315 ? Fe2+-O
363
415
352, 369
410
348, 368
400, 423
Fe2+-O
533, 566 512, 531, 564 507, 528 deformation modes of Si4O11
665 663 659 νs of the Si-Ob-Si (ν1)
747, 761,
785
909
750, 764,
779, 788
907
-

904
νs of the O-Si-O
971 970 968 νas of the O-Si-O
999, 1027
1098
999, 1024
1099
1020, 1093 νas of the Si-Ob-Si
? - questionable interpretation; νs - symmetric stretching; νas - asymmetric stretching.

Below 625 cm-1, the wavenumber exhibits three main bands and other bands that can be considered part of the main bands. As we have discussed in the Raman modes of amphiboles (see reference paper1) part and according to Rinaudo et al. (2004), the bands between 210-300 cm-1 are assigned to the O-H-O groups or, if we respect the assignments of Shurvell et al. (2001) and Huang (2003), this region may be ascribed to lattice vibration – both are questionable, but the second assignment is more plausible. Therefore, the peaks at 242 cm-1 and 289 cm-1 belong to the O-H-O group or the lattice mode. Not the same thing can be said about the peak at 315 cm-1 (despite the first impression), because it is more of a part of M-O vibrations. However, this assignment (of the 315 cm-1 peak) remains controversial if we look at the spectra compared with the 1-1 grunerite sample; another reason is the very low intensity.

If we take a look at the ideal chemical formula of grunerite (□Fe2+7Si8O22(OH)2), just Fe2+ is involved in the external vibrations (M2+-O); consequently, the bands situated at 363 cm-1 and 415 cm-1 may be ascribed to the Fe2+-O vibration mode.

The spectrum of grunerite also presents two bands at 533 cm-1 and 566 cm-1, respectively, which may be assigned to the deformation mode of the silicate chain. According to Kloprogge et al. (2001), the libration and translation modes of OH- lie in the same spectral region, are probably overlapped or the very low intensity peak at 566 cm-1 may be assigned to the librational or translational mode of the OH- group – this assignment is, however, uncertain.

References

• The Mineralogy Database [link]

• Crystal data (.cif file) from the American Mineralogist Crystal Structure Database [link]

1APOPEI A. I., BUZGAR N. (2010) - The Raman study of amphiboles. Anal. Şt. Univ. “Al. I. Cuza” Iaşi, Geologie, LVI/1 [link]

• Grunerite spectrum from the RRUFF project [link]

• Downs, R. T. 2006. The RRUFF Project: an integrated study of the chemistry, crystallography, Raman and infrared spectroscopy of minerals. Program and Abstracts of the 19th General Meeting of the International Mineralogical Association in Kobe, Japan. O03-13.

• Bard, T., Yarwood, J., Tylee, B. (1997) - Asbestos fiber identification by Raman microspectroscopy. J. Raman Spectrosc., 28, 803-809

• Rinaudo, C., Belluso, E., Gastaldi, D. (2004) - Assessment of the use of Raman spectroscopy for the determination of amphibole asbestos. Mineralogical Magazine 68 (3): 443-453.

• Huang, E. (2003) - Raman Spectroscopic Study of Amphiboles. PhD thesis in Chinese.

• Kloprogge, J. T., Visser, D., Ruan, H., Frost, R. L. (2001) - Infrared and Raman spectroscopy of holmquistite, Li2(Mg,Fe2+)3(Al,Fe3+)2(Si,Al)8O22(OH)2. Journal of Materials Science Letters, 20, 1497-1499.