EMAIL subscription
SPAFMSR


Buzgar N., Apopei A. I., Buzatu A. (2009) - Romanian Database of Raman Spectroscopy (http://rdrs.uaic.ro)
| Why donate? If you use this site regularly and would like to help us, please consider donating a small sum. All proceeds go to: + development of this website; + buy some minerals not available yet; + development of RDSS software; + buy some articles or books necessary for Raman study (interpretation). |


Formula: |
Ca2(Mg,Fe++)5Si8O22(OH)2 |
|
Crystal Data: |
Crystal System: Monoclinic - Prismatic |
|
Point Group: 2/m |
||
Cell Data: |
Space Group: C 2/m, a = 9.84, b = 18.1, c = 5.28, Z = 2 |
|
| Using the mouse (click here for more information) |
Density (calc.) = 3.11 and V = 909.61 Å3 |
|
| Element color: Ca, Mg, Fe, Si, O, H | ||
 |
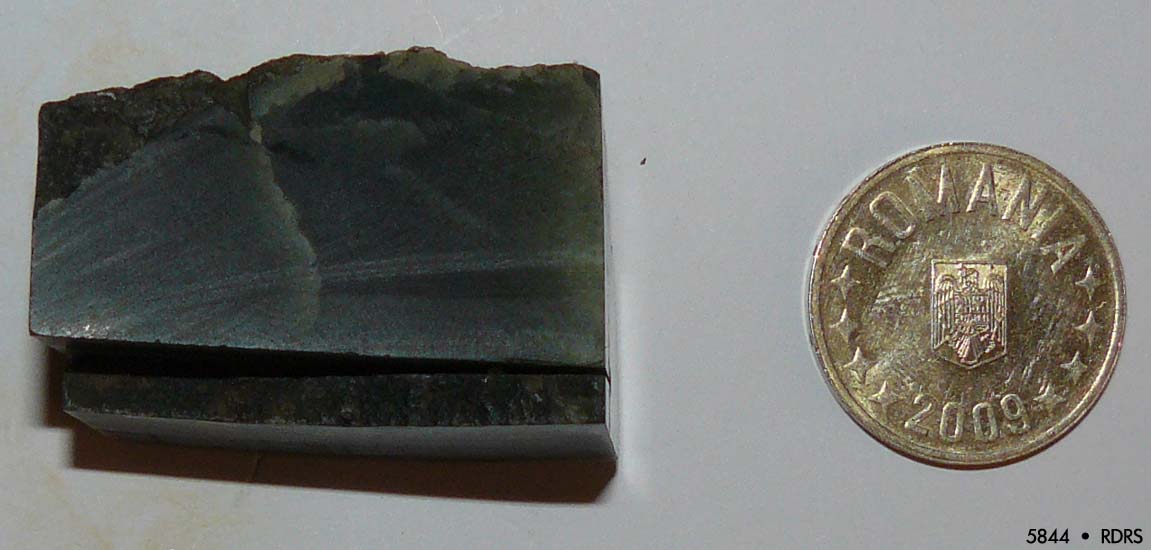 |
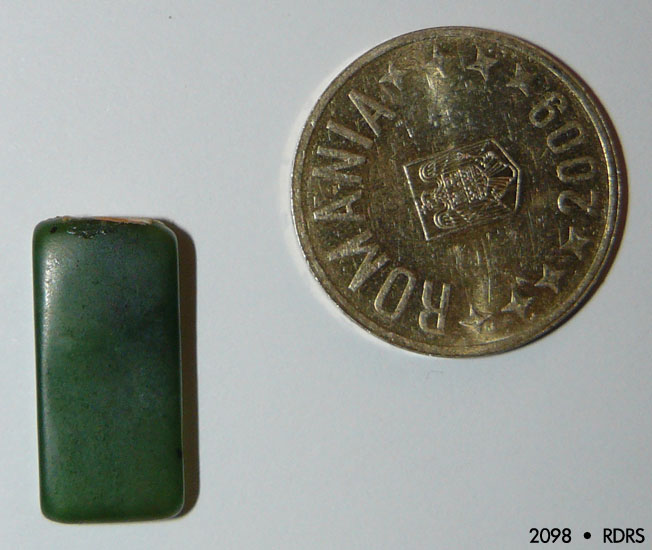
Sample no. 2098 and 5844 from the "Mineralogy and Petrography Museum Grigore Cobălcescu" of "Alexandru Ioan Cuza" University, Iaşi. Origin (no. 2098): Jordanów, Poland. Origin (no. 5844): China. Click image to enlarge |
Toggle Grid Toggle Coordinates Reverse Spectrum |
Download spectrum: Raman spectrum .txt Raman spectrum .spc |
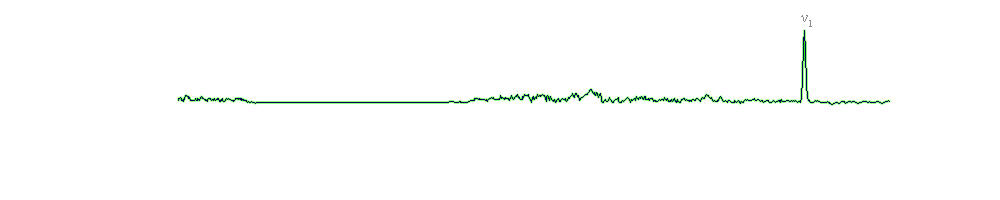
Figure 6 (see reference paper1) shows the Raman spectra of two samples of nephrite minerals (on this page), one sample of smaragdite and, finally, one of uralite (with a spectrum of quartz, see further discussion). All these samples are varieties of actinolite; in general, discussions regarding the vibrations and assignments of samples of these varieties are the same with discussions regarding actinolite (see Actinolite Raman spectrum and vibrations intepretation page).
The wavenumbers of 2-4 and 2-5 (nephrite samples) are found in column 1 and 2 of the below table. The third and fourth columns of that table contain the wavenumbers reported in the literature (Shurvell et al., 2001; Huang, 2003). The Raman spectra of nephrite samples, like those of actinolite, are dominated by a very strong sharp band at 674 cm-1; these bands are assigned to the symmetric stretching (νs) of Si-Ob-Si bridges. The bands between 745-747 cm-1 are difficult to assign (see discussion of actinolite). Nevertheless, we consider these bands tentative assignments of Si-Ob-Si bridges (also, this assignment is valid for samples of smaragdite and uralite). The main peak of this region – 928 cm-1 (around 920-950 cm-1) and one overlapped – 946 cm-1 (these values are identical in both spectra) may be ascribed to the νs (symmetric stretching) of the O-Si-O linkage. The asymmetric stretching region of the O-Si-O linkage (950-1000 cm-1) shows (at least for sample 2-4) a peak with a very low intensity. In the case of the 1027 cm-1 peak and 1059 cm-1 highest peak (in comparison with the 1027 cm-1 one; in both spectra of nephrite samples), they may be ascribed to the νas (asymmetric stretching) of the Si-Ob-Si bridges.
| Apopei and Buzgar (2010)1 | Shurvell et al. (2001) | Huang (2003) | Tentative assignment | |
| Sample: 2098 (2-4) | 5844 (2-5) | #Mg 90 | ||
| 222, 250, 266, 296 |
222, 249, 296 |
225, 232, 249, 301 |
222, 230, 248, 286, 301 |
lattice mode |
| 349 369 392 413 435 |
350 368 392 412 434 |
351 370 393 415 436 |
350 368 392 414 435 |
M-O, where M = Ca and Mg, Fe2+ |
| 483, 527 | 525 | 516, 529 | 528 | deformation modes of Si4O11 |
| 674 | 674 | 673 | 653, 673 | νs of the Si-Ob-Si (ν1) |
| 747 | 745 | 747 | 738, 748 | ? νs of the Si-Ob-Si |
| 928, 946 | 928, 946 | 868, 931, 947 |
929, 946 | νs of the O-Si-O |
| 970 | - | - | - | ? νas of the O-Si-O |
| 1027, 1059 | 1027, 1059 |
1029, 1059 | 1028, 1057 | νas of the Si-Ob-Si |
| - | - | 1114 | - | |
| - | - | 1140 | - | |
| ? - questionable interpretation; νs - symmetric stretching; νas - asymmetric stretching; Mg# = (Mg/Mg+Fe2+). | ||||
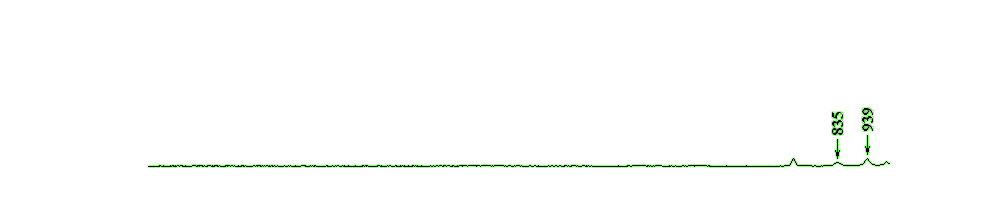
In the external vibration region, a group of five peaks (for 2-4: 349, 369, 392, 413, 435 cm-1 and for 2-5: 350, 368, 392, 412, 434 cm-1) centred on a band at 392 cm-1 (in both spectra of nephrite samples) are shown in the spectral domain assigned to M-O vibration. Shurvell et al. (2001) state that these Raman bands are characteristic for nephrite, in comparison with the jadeite mineral. The peaks between 210-300 cm-1 may be ascribed to lattice modes. For 2-4, two bands, namely at 483 cm-1 (low intensity) and 527 cm-1, respectively, may be assigned to the deformation mode of the Si4O11 group. In another sample of nephrite (2-5), only one peak appears, at 525 cm-1, which is assigned to the same deformation mode of the Si4O11 group.
The Raman spectrum of smaragdite (2-6) is slightly different from those recorded on samples of actinolite (the same thing may be said about the Raman spectrum of the uralite sample, but this will be discussed separately). The wavenumbers and assignments of smaragdite and uralite samples (quartz included) are found in table (see above links of smaragdite and uralite) of smaragdite and uralite webpage in comparison with (2-2) actinolite, in order to emphasize small differences between them.
In the case of nephrite samples, in Shurvell et al. (2001) there are two bands in the spectrum of nephrite, at 1114 cm-1 and 1140 cm-1, respectively, which are assigned to OH- bending modes. In our samples (2-4 and 2-5), however, these bands do not appear.
• The Mineralogy Database [link]
• Crystal data (.cif file) from the American Mineralogist Crystal Structure Database [link]
• 1APOPEI A. I., BUZGAR N. (2010) - The Raman study of amphiboles. Anal. Şt. Univ. “Al. I. Cuza” Iaşi, Geologie, LVI/1 [link]
• Huang, E. (2003) - Raman Spectroscopic Study of Amphiboles. PhD thesis in Chinese.
• Shurvell, H. F., Rintoul, L., Fredericks, P. M. (2001) - Infrared and Raman spectra of jade and jade minerals. Internet Journal of Vibrational Spectroscopy, (www.ijvs.com) 5, 5, 4.
| ©2009 - 2014 http://rdrs.uaic.ro • RDRS team | | | | Home • Raman Spectroscopy • Search data • Blog • Links • About • Contact |
| Compatible browsers: Firefox 3+, Microsoft Internet Explorer 8+, Google Chrome 2.0+, Opera 9+ Disabling browser functions such as Javascript may cause certain functionality to be unavailable. |
Romanian Database of Raman Spectroscopy by Buzgar N., Apopei A. I., Buzatu A. is licensed under a Creative Commons Attribution-NonCommercial-NoDerivs 3.0 Unported License. Based on a work at rdrs.uaic.ro. Permissions beyond the scope of this license may be available at http://rdrs.uaic.ro/contact.html. |

|
|
| RDRS Stats |
 Share this page