EMAIL subscription
SPAFMSR


Buzgar N., Apopei A. I., Buzatu A. (2009) - Romanian Database of Raman Spectroscopy (http://rdrs.uaic.ro)
| Why donate? If you use this site regularly and would like to help us, please consider donating a small sum. All proceeds go to: + development of this website; + buy some minerals not available yet; + development of RDSS software; + buy some articles or books necessary for Raman study (interpretation). |


Formula: |
K2SO4 |
|
Crystal Data: |
Crystal System: Orthorhombic - Dipyramidal |
|
Point Group: 2/m 2/m 2/m |
||
Cell Data: |
Space Group: Pmcn, a = 5.76, b = 10.05, c = 7.46, Z = 4 |
|
Density (calc.) = 2.68 and V = 431.84 Å3 |
||
| Element color: K, S, O | ||
 |
Synthetic sample Click image to enlarge |
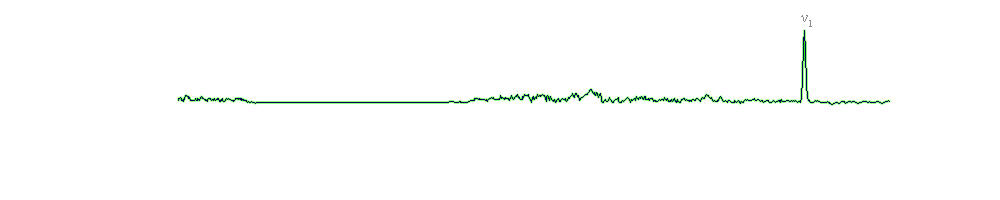
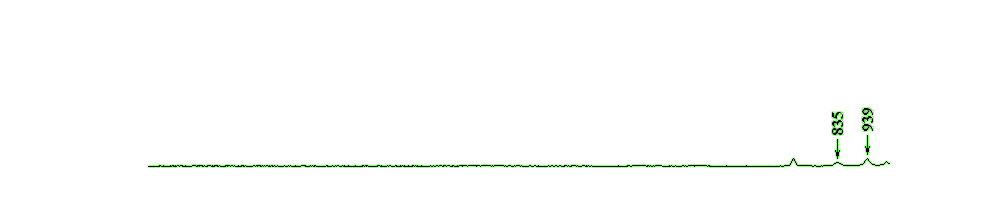
The Raman spectrum of the arcanite has the strongest intensity band at 985 cm-1, which was assigned to the symmetric stretching mode ν1 of SO4 tetrahedra. The ν2 mode (symmetric bending) appears at 457 cm-1, the ν3 mode (triply degenerate asymmetric stretching) at 1097 cm-1, 1108 cm-1 and 1146 cm-1. The ν4 mode (asymmetric bending) was found at 622 cm-1.
| Arcanite | Assignments | |
| Buzgar et al., 20091 | Montero et al., 1974 | |
| 453 | ν2 SO4 | |
| 457 | 457 | |
| 617 | ν4 SO4 | |
| 622 | 622 | |
| 985 | 983 | ν1 SO4 |
| 1094 | 1093 | ν3 SO4 |
| 1108 | 1109 | |
| 1110 | ||
| 1146 | 1145 | |
• The Mineralogy Database [link]
• Crystal data (.cif file) from the American Mineralogist Crystal Structure Database [link]
• 1BUZGAR N., BUZATU A., SANISLAV I. V. (2009) - The Raman study on certain sulfates. Analele Stiintifice ale Universitatii “Al. I. Cuza” - Iasi, Tome 55, issue 1, 5-23 [link]
• MONTERO S., SCHMOLZ R. (1974) - Raman spectra of orthorhombic sulfate single crystals I: K2SO4, Rb2SO4, Cs2SO4 and Tl2SO4. Journal of Raman Spectroscopy, 2, p. 101-113 [link]
| ©2009 - 2014 http://rdrs.uaic.ro • RDRS team | | | | Home • Raman Spectroscopy • Search data • Blog • Links • About • Contact |
| Compatible browsers: Firefox 3+, Microsoft Internet Explorer 8+, Google Chrome 2.0+, Opera 9+ Disabling browser functions such as Javascript may cause certain functionality to be unavailable. |
Romanian Database of Raman Spectroscopy by Buzgar N., Apopei A. I., Buzatu A. is licensed under a Creative Commons Attribution-NonCommercial-NoDerivs 3.0 Unported License. Based on a work at rdrs.uaic.ro. Permissions beyond the scope of this license may be available at http://rdrs.uaic.ro/contact.html. |

|
|
| RDRS Stats |
 Share this page