Please cite this website as:

Buzgar N., Apopei A. I., Buzatu A. (2009) - Romanian Database of Raman Spectroscopy (http://rdrs.uaic.ro)


PIGMENTS


MINERALS


EMAIL subscription


SPAFMSR

PNII - IDEI COD 2119/2008


Alexandru Ioan Cuza UniversityFaculty of Geography and Geology

Locations of visitors to this page

Why donate? If you use this site regularly and would like to help us, please consider donating a small sum.
All proceeds go to:
+ development of this website;
+ buy some minerals not available yet;
+ development of RDSS software;
+ buy some articles or books necessary for Raman study (interpretation).

Decrease Font Size Increase Font Size
Don't forget to bookmark us! | Share this page


Augite: Crystal structure | Sample photo | Raman spectrum | Interpretation | References

Crystal structure of Augite

Formula:

(Ca,Na)(Mg,Fe,Al,Ti)(Si,Al)2O6

Crystal Data:

Crystal System: Monoclinic - Prismatic

Point Group: 2/m

Cell Data:

Space Group: C 2/c, a = 9.8, b = 9, c = 5.25, Z = 4

Using the mouse (click here for more information)

Density (calc.) = 3.51 and V = 447.27 Å3

Element color: Ca, Na, Mg, Fe, Al, Ti, Si, O
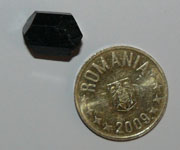
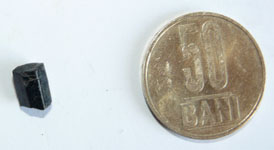
Augite samples (no. 3974 and Techereu)
Augite (no. 3974) Augite (Techereu)

Sample no. 3974 and Techereu from the "Mineralogy and Petrography Museum Grigore Cobălcescu" of "Alexandru Ioan Cuza" University, Iaşi.

Origin (no. 3974): Germany.

Origin (Techereu): Techereu, Romania.


Click image to enlarge

Raman spectrum of Augite (no. 3974)

Toggle Grid Toggle Coordinates Reverse Spectrum

Download spectrum:


Raman spectrum .txt

Raman spectrum .spc

Raman spectrum of Augite (Techereu)

Toggle Grid Toggle Coordinates Reverse Spectrum

Download spectrum:


Raman spectrum .txt

Raman spectrum .spc

Interpretation of Raman spectrum of Augite

In the Raman spectrum of augite (see above spectrum), the stretching modes of Si-Onbr are observed to have the highest intensity at 1006 cm-1, and weaker peaks at 863 cm-1, 928 cm-1, 1043 cm-1 and 1102 cm-1. The bands assigned to the stretching of the Si-Obr bonds are located at 667 cm-1, 707 cm-1 and 769 cm-1. The 533 cm-1 and 555 cm-1 bands are attributed to the bending of O-Si-O bonds. The cation-oxygen vibrations appear at lower frequencies, below 400 cm-1 (see below table).

Based on the chemical composition of the augite specimens from the Techereu area (Apuseni Mountains, Romania), the formula resulting for this mineral is the following: (Ca0.844Na0.034K0.009Mg0.113)(Mg0.737Fe3+0.226Fe2+0,007Ti0,014Al0.014Mn0.002)[(Si1.832Al0.168)O6] (see below table - 2nd table) (Stoicovici, 1968). The high content of Ca and Mg makes the augite from Techereu very similar to the diopside structure. The Raman spectrum of augite is also similar to the diopside spectrum (see figure 2 from reference paper1). The bands in the low region of the augite and diopside Raman spectra are located at a maximum difference of 5 cm-1; the highest peak assigned to the stretching modes of Si-Onbr is slightly lower in augite than in diopside (1006 cm-1 and 1010 cm-1, respectively), caused probably by the Al content in the tetrahedral sites. More bands appear in the augite spectrum, at 707 cm-1, 769 cm-1 and 1102 cm-1. From the Raman spectra of the other augite sample studied (3974), it can be concluded that the specimen is also similar to diopside; a difference in the Raman spectra appears in the 700-1000 cm-1 region (see below table), were more bands are observed in augite than in diopside, probably due to the presence of a high Al content.


Raman IR
Buzatu and Buzgar (2010)1 Huang et al. (2000) Assignments Buzatu and Buzgar (2010)1
sample from Techereu
Makreski et al. (2006) Assignments
sample from
Techereu
3974
226
299
327
355
392


324
352
389


323
352
387
M-O stretch/bend 390
399
478
515
393

469
521
M-O stretch/bend


533
555
477

532
555
461
508
531
556
O-Si-O bend 634
665
673
634

673
O-Si-O bend
667 663 662 Si-Obr stretch
707
769

863


928
1006
1043
1102
714
771
816
853
878
896
924
1006
1037
1109
769

862


1007
1038
Si-Onbr stretch 873

969
872
919
974
Si-Obr stretch
1070 1075 Si-Onbr stretch

The infrared spectrum of augite (see figure 3 from reference paper1) revealed bands at frequencies of 87 cm-1, 969 cm-1 and 1070 cm-1, attributed to the stretching of the Si-O bonds; 1070 cm-1 is considered to be caused by the Si-Onbr stretch, while the bands at smaller frequencies are assigned to the Si-Obr stretch. The bending modes are observed at 634 cm-1, 665 cm-1 and 673 cm-1. Below 520 cm-1, the vibrations between cation and oxygen are presented as four bands: 390 cm-1, 399 cm-1, 478 cm-1 and 515 cm-1. This assignment for IR bands of augite was also made by Makreski et al. (2006).


Oxide wt% Cations calculated at 6 oxygen atoms
SiO2 48.42 Si 1.832
TiO2 0.5 Ti 0.014
Al2O3 4.08 Al 0.182
Fe2O3 7.94 Fe3+ 0.226
FeO 0.22 Fe2+ 0.007
MnO 0.07 Mn 0.002
MgO 15.08 Mg 0.850
CaO 20.82 Ca 0.844
K2O 0.19 K 0.009
Na2 0.46 Na 0.034
LOI 1.02 O 6
H2O 0.38
Total 99.18

The group theory predicts for c2/c clinopyroxenes the following normal modes of vibration: 14Ag (R) + 16Bg (R) + 13Au (IR) + 14Bu (IR) (Rustein and White, 1971). There are no modes which are Raman and IR active at the same time. An ideal SiO4 tetrahedron has four fundamental modes: ν1 symmetric stretching, νM2 symmetric bending, ν3 asymmetric stretching and ν4 asymmetric bending. A large cation in the structure can distort the SiO4 tetrahedra. This will make ν1 and ν2 Raman active, and ν3 and ν4 – IR active (Mills et al., 2005). In the case of our augite, we can assume that the Ca cation is producing the distortion and then the symmetric modes will be Raman active and the asymmetric ones will be IR active. Under these circumstances, the assignment made by Makreski et al. (2006) for the IR spectrum and ours for the Raman spectrum (see above table) are correct, based also on the rule that in SiO4 tetrahedra ν2< ν4 and ν1< ν3 (Nakamoto, 2009).


References

• The Mineralogy Database [link]

• Crystal data (.cif file) from the American Mineralogist Crystal Structure Database [link]

1BUZATU A., BUZGAR N. (2010) - The Raman study of single-chain silicates. Anal. Şt. Univ. “Al. I. Cuza” Iaşi, Geologie, LVI/1. [link]

• Stoicovici, E., (1968) - The augite in the diabase from Techerău (Hunedoara). Bul. Soc. de Șt. Geol., XI, 203–211. (In Romanian).

• Huang, E., Chen, C.H., Huang, T., Lin, E.H., Xu, J., (2000) - Raman spectroscopic characteristics of Mg-Fe-Ca pyroxenes. American Mineralogist, 85, 473–479.

• Makreski, P., Jovanovski, G., Gajović, A., Biljan, T., Angelovski, D., Jaćimović, R., (2006) - Minerals from Macedonia. XVI. Vibrational spectra of some common appearing pyroxenes and pyroxenoids. Journal of Molecular Structure, 788, 102–114.

• Rutstein, M.S., White, W.B., (1971) - Vibrational spectra of high-calcium pyroxenes and pyroxenoids. American Mineralogist, 56, 877–887.

• Mills, S.J., Frost, R.L., Kloprogge, J.T., Weier, M.L., (2005) - Raman spectroscopy of the mineral rhodonite. Spectrochimica Acta, Part A, 62, 171–175.

• Nakamoto, K., (2009) - Infrared and Raman Spectra of Inorganic and Coordination Compounds, Part A: Theory and Applications in Inorganic Chemistry (Sixth edition). John Wiley and Sons, New Jersey