

PIGMENTS
- Standards (35)
- White (13)

- Black (8)

- Red (4)

- Green (5)

- Blue (3)

- Yellow (2)

- White (13)
- Artefacts (270)
- Cucuteni pottery (142)
- Scânteia 1998 L9 (5)
- Hoiseşti L11 (23)
- Ruginoasa 2004 sub B7 (1)
- Aldești (7)
- Podei (3)
- Trebeș (7)
- Rusăiești (17)
- Fetești (A) (14)
- Fetești (B) (15)
- Mihoveni-Cahla Morii (14)
- Preutești (A) (15)
- Fulgeriș (21)
- Greek artefacts (pottery, painted walls) (66)
- Orgame (15)
- Beroe (41)
- 01 Beroe

- 02 Beroe

- 03 Beroe

- 04 Beroe
- 05 Beroe
- 06 Beroe
- 07 Beroe
- 01 Beroe C
- 02 Beroe C

- 03 Beroe C
- 04 Beroe C

- 05 Beroe C
- 06 Beroe C
- 07 Beroe C
- 08 Beroe C
- 09 Beroe C
- 10 Beroe C

- 11 Beroe C
- 12 Beroe C
- 13 Beroe C
- 14 Beroe C
- 15 Beroe C
- 16 Beroe C
- 17 Beroe C
- 18 Beroe C
- 19 Beroe C
- 20 Beroe C
- 21 Beroe C

- 22 Beroe C
- 23 Beroe C
- 24 Beroe C
- 25 Beroe C
- 26 Beroe C
- 27 Beroe C
- 28 Beroe C
- 29 Beroe C
- 30 Beroe C
- 31 Beroe C
- 32 Beroe C
- 33 Beroe C
- 34 Beroe C
- 01 Beroe
- Ibida (1)
- Niculițel (9)
- Roman artefacts (pottery, painted walls) (62)
- Argamum (15)
- Beroe (41)
- 01 Beroe
- 02 Beroe
- 03 Beroe
- 04 Beroe
- 05 Beroe
- 06 Beroe
- 07 Beroe
- 01 Beroe C
- 02 Beroe C
- 03 Beroe C
- 04 Beroe C
- 05 Beroe C
- 06 Beroe C
- 07 Beroe C
- 08 Beroe C
- 09 Beroe C
- 10 Beroe C
- 11 Beroe C
- 12 Beroe C
- 13 Beroe C
- 14 Beroe C
- 15 Beroe C
- 16 Beroe C
- 17 Beroe C
- 18 Beroe C
- 19 Beroe C
- 20 Beroe C
- 21 Beroe C
- 22 Beroe C
- 23 Beroe C
- 24 Beroe C
- 25 Beroe C
- 26 Beroe C
- 27 Beroe C
- 28 Beroe C
- 29 Beroe C
- 30 Beroe C
- 31 Beroe C
- 32 Beroe C
- 33 Beroe C
- 34 Beroe C
- 01 Beroe
- Noviodunum/Isaccea (6)
- Cucuteni pottery (142)
- Monastery frescoes (23)
MINERALS
- I.Native Elements (2)
- II.Sulfides (6)
- III.Oxides and Hydroxides (8)
- Simple Oxides (5)
- Oxides Containing Uranium and Thorium (2)
- Multiple Oxides (1)
- IV.Halides (1)
- Oxyhalides and Hydroxyhalides (1)
- V.Carbonates, Nitrates, Borates (13)
- Anhydrous Carbonates (10)
- Hydroxyl or Halogen (3)
- VI.Sulfates, Chromates, Molybdates (15)
- Anhydrous Acid and Sulfates (6)
- Hydrated Acid and Sulfates (7)
- Anhydrous Sulfates Containing Hydroxyl or Halogen (2)
- VII.Phosphates, Arsenates, Vanadates (0)
- Under construction
- IX.Organic Minerals (0)
- Under construction
- VIII.Silicates (26)
- Nesosilicates (1)
- Nesosilicate Insular SiO4 Groups and O, OH, F, and H2O (1)
- Sorosilicates (0)
- Under construction
- Cyclosilicates (1)
- Beryl group (1)
- Inosilicates (21)
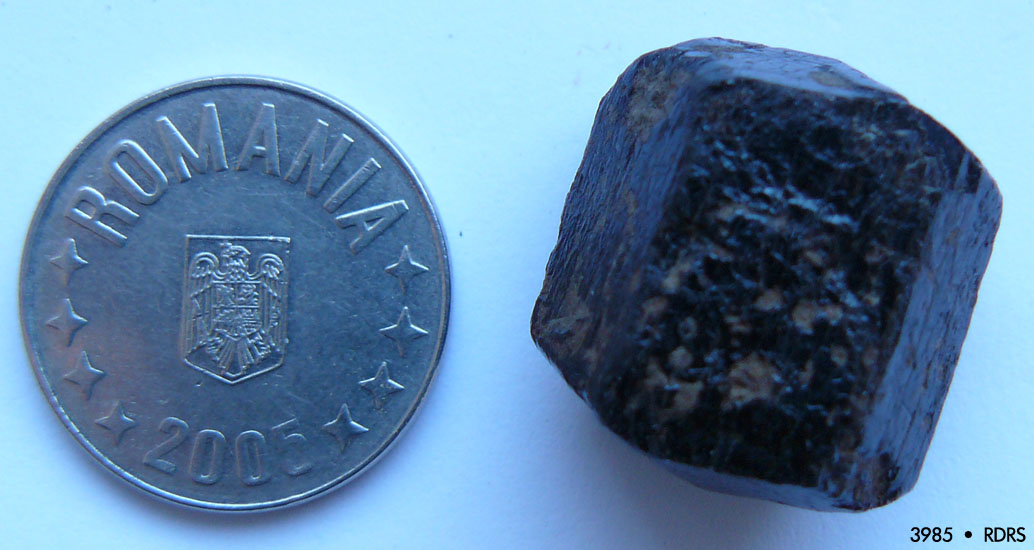
- Pyroxenes (8)
- Magnesium - Iron (2)
- Calcium (3)
- Calcium - Sodium (1)
- Sodium (1)
- Lithium (1)
- Pyroxenoids (4)
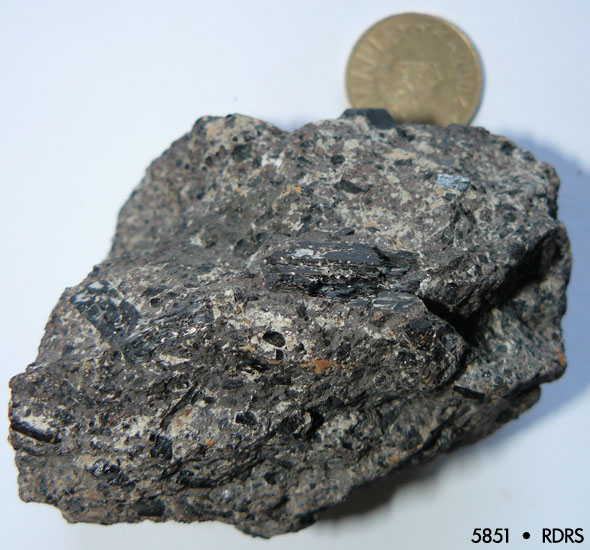
- Amphiboles (9)
- Mg-Fe-Mn-Li (1)
- Calcic (6)
- Sodic (2)
- Pyroxenes (8)
- Phyllosilicates (0)
- Under construction
- Tektosilicates (3)
- Si Tetrahedral Frameworks (1)
- Al-Si Framework (2)
- Not Classified Silicates (0)
- Under construction
- Nesosilicates (1)
EMAIL subscription
SPAFMSR


 Share this page